
Board Pack (Riley)
Bottom-Up Partnership Model
The North Star target and category mix computed from the bottom-up drivers.
Bottom-Up Partnership Model (Riley)
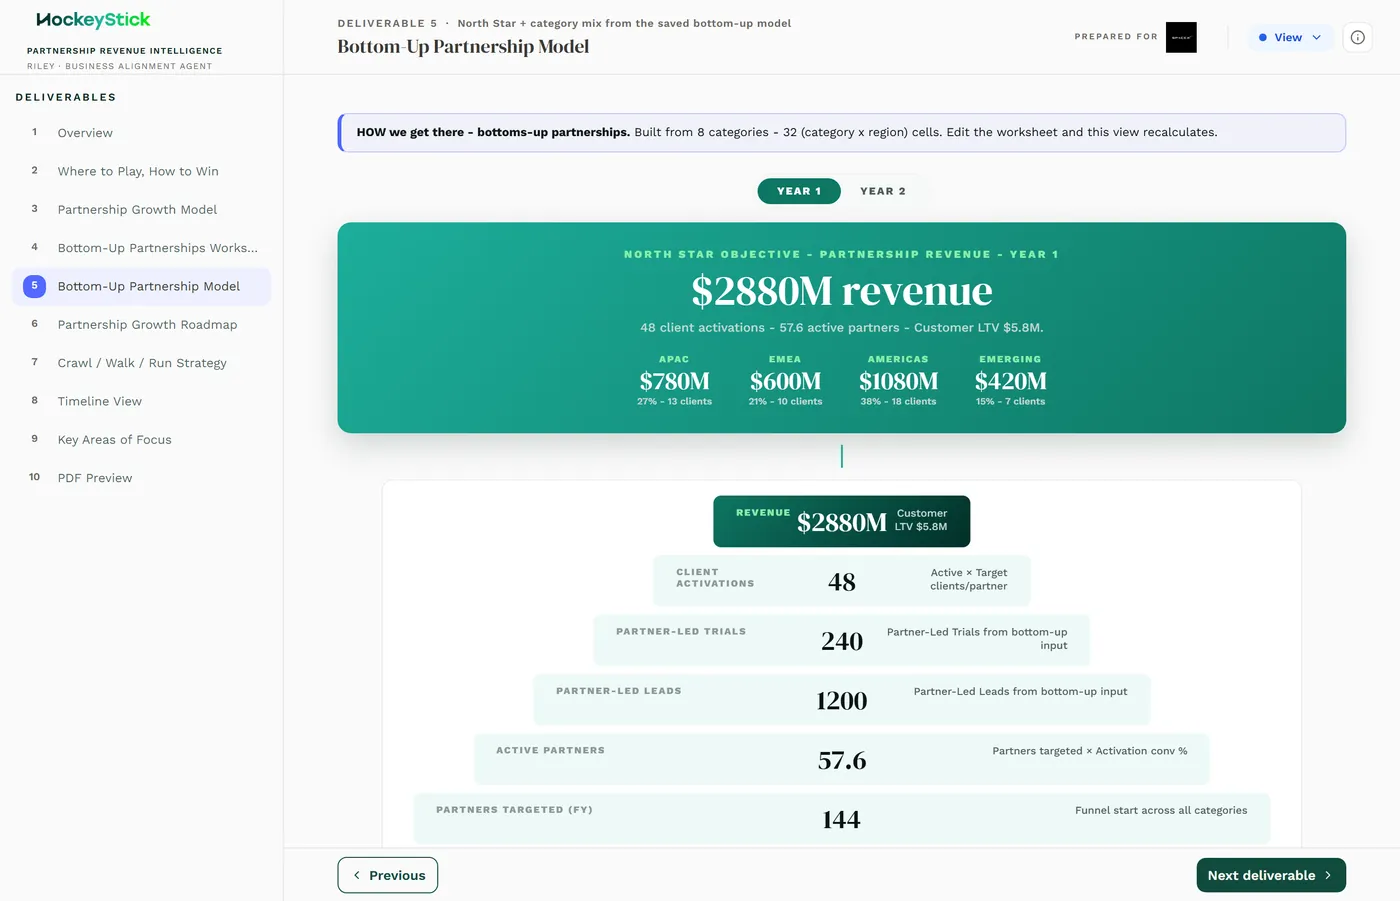
The Bottom-Up Partnership Model is the North Star revenue target and the category mix, built up from the drivers the client can defend rather than handed down from the top.
What it is
A REPORT deliverable in the Board Pack (Partnership Playbook). It is computed, not hand-written: it reads from the Bottom-Up Partnerships Worksheet and rolls the drivers there up into a revenue target and a mix across partner categories. Because it is derived, you do not edit this page directly. To change what it shows, fix the worksheet and the model recalculates. Riley builds it on Alex's published Opportunity Map. The page is headed "HOW we get there, bottoms-up partnerships."
What each section means
- North Star revenue. The headline target the model builds up to (the live
example shows a revenue figure at the top of the page). This is the number the board is being asked to believe, assembled from the category drivers rather than asserted.
- Category mix. The partner categories, each with its share of the target. The
live page lists the canonical categories (Strategic/Alliance, Reseller, Marketplace, Referral, OEM/Embedded, Channel, Affiliate, Technology). The mix tells the client where the growth actually comes from, so a category carrying an outsized share is worth a second look at its drivers.
- Top-Down vs Bottom-Up vs Variance comparison. A table that sets the
top-down ambition against what the bottom-up drivers actually produce. Its columns are Metric, Top-Down, Bottom-Up, Variance, Status. The Variance is the gap between the two, and the Status flags whether the bottom-up build supports the top-down goal. A large variance means the drivers and the ambition disagree, which is exactly what this page exists to surface before the board sees it.
Reviewing it before publishing
- The worksheet is right first. This page only reflects the drivers. If a
number looks wrong here, fix it in the Bottom-Up Partnerships Worksheet, not on this page.
- The variance is explainable. Check the Top-Down vs Bottom-Up comparison. If
the Variance is large, either the ambition or the drivers need revisiting, and you should be able to say which.
- The category mix is believable. No single category carries a share the
client cannot picture. An outsized category usually points to an optimistic driver in the worksheet.
- The North Star sense-checks against today. Compare the target to the client's
current revenue. A jump the client cannot picture is a signal to revisit the drivers before publishing.