
Workshop Pack (Sam)
Definition of the Ecosystem
The interactive landscape map of the partner ecosystem, and how to read it.
Definition of the Ecosystem (Sam)
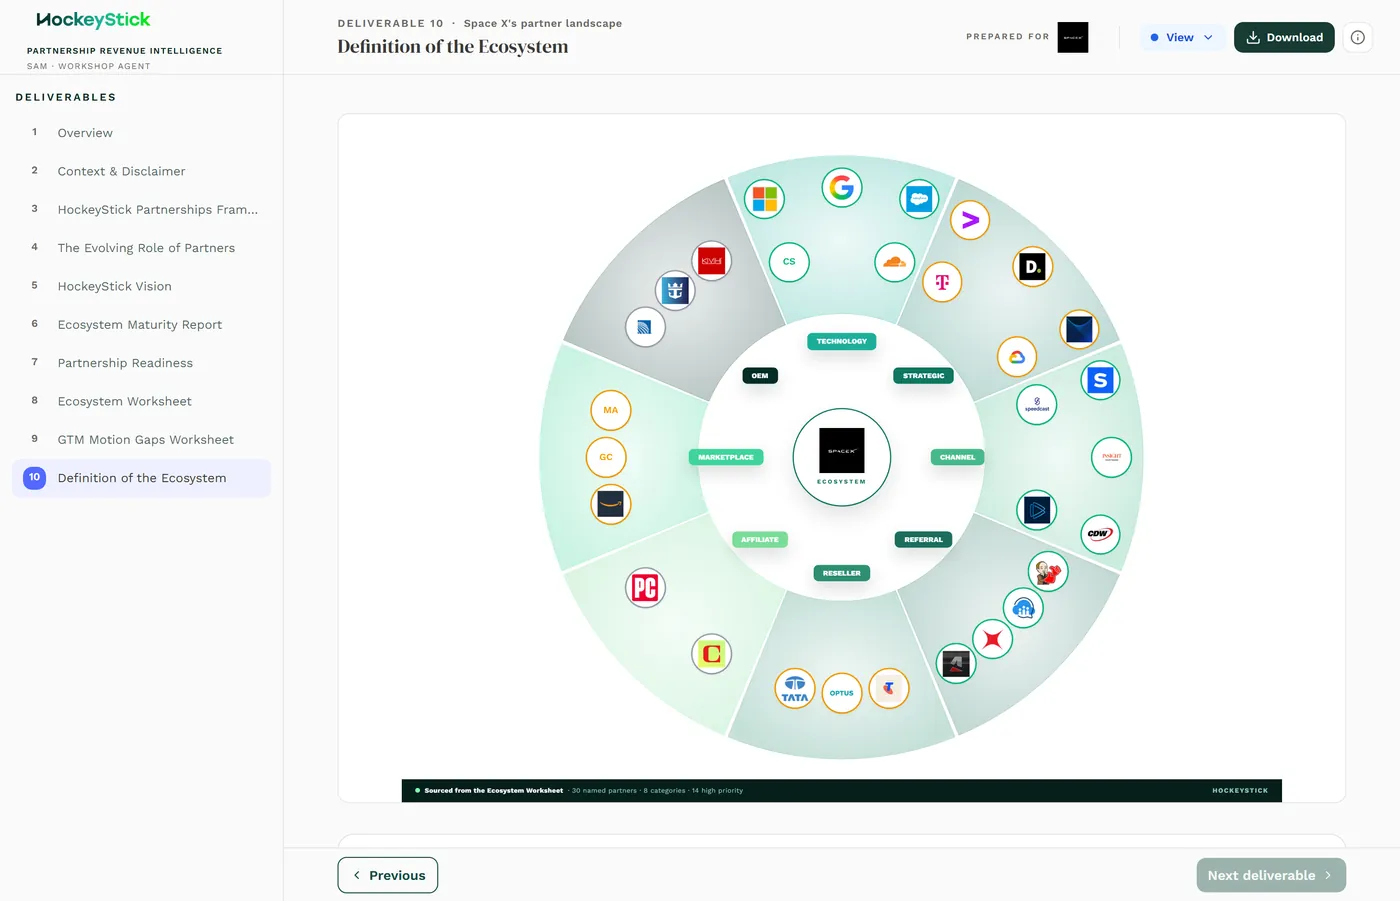
The Definition of the Ecosystem is the interactive landscape map of the client's partner ecosystem: their company at the centre, partner categories as rings, and named partners plotted by how well they fit and how much revenue they could drive.
What it is
A DIAGNOSTIC deliverable, content class deterministic. It does not read from the intake and it is not separately edited. It reads entirely from the Ecosystem Worksheet and renders it as a picture. Every number on the map came from the scores you set on that worksheet, so if the map is wrong, the fix is on the worksheet, not here.
What each section means
- The map. The client sits at the centre. Partner categories form the rings around them, and named partners are plotted within their category.
- The axes. Partners are positioned by fit and revenue potential, the same Fit (strategic_fit) and Revenue potential (revenue_potential) scores from the Ecosystem Worksheet. Higher fit and higher revenue potential pull a partner toward the more prominent position on the map.
- The category rings. Each partner category is a ring or wedge. Categories with no score and no named partners are hidden, so the map only shows what has actually been worked on.
- Sorted by composite score. The note on the page reads "categories captured on the worksheet, sorted by composite score" and "sourced from the Ecosystem Worksheet". Composite is Fit plus Revenue potential minus Effort, the worksheet's ranking number.
- Top-3 highlighting. The three categories with the highest composite are highlighted, the same top three that surface into the downstream plan. This is the map's answer to "where should we focus".
Reviewing it before publishing
- The worksheet is finished first. This map is only as complete as the Ecosystem Worksheet behind it. Review and finish the worksheet before you look at the map.
- The right categories are highlighted. The top three by composite should be the ones you would name as the priorities. If the highlighting looks wrong, the scores on the worksheet are wrong, not the map.
- Partners sit where they should. Spot-check a few plotted partners against their Fit and Revenue potential scores. A partner in an odd position usually means a miskeyed score on the worksheet.
- No expected category is missing. A category vanishes from the map when it has no score and no named partners. If one you expected is absent, go back and score it on the worksheet.
- Fix it on the worksheet. There is nothing to edit on this page. Every correction is made on the Ecosystem Worksheet and the map re-renders from it.