
Board Pack (Riley)
Bottom-Up Partnerships Worksheet
Capture the drivers per category that build the North Star revenue target.
Bottom-Up Partnerships Worksheet and Model (Riley)
This is where Riley turns partnership ambition into a number the client's board will believe. You capture a handful of drivers for each partner category and region, and the Bottom-Up Partnership Model rolls them up into a North Star revenue target and a category mix. The worksheet is only as strong as the drivers you put in, so every field is an assumption you should be able to defend out loud.
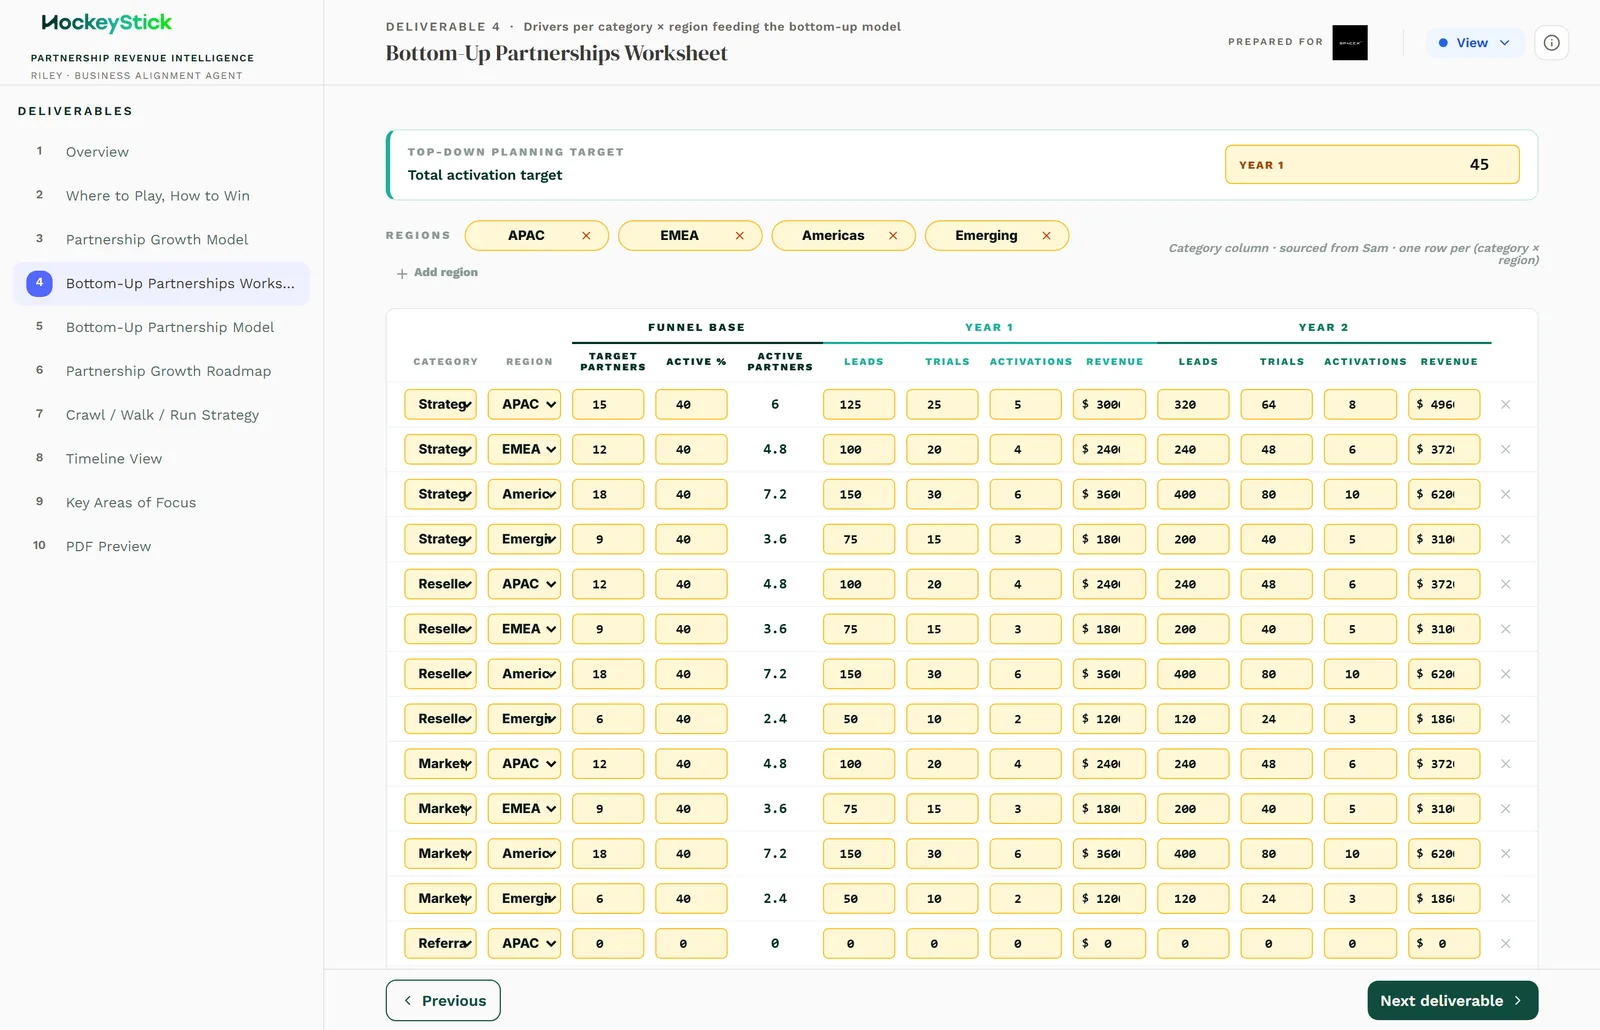
The drivers per category and region
You enter these per partner category, and by region where the client operates in more than one:
| Driver | What it is |
|---|---|
| Target partners | The number of partners you plan to recruit in this category. |
| Active partners | The number you expect to actually activate and produce revenue. |
| Average deal size (USD) | The typical deal value a partner in this category sources or influences. |
| Win rate (%) | The share of sourced opportunities that convert to closed revenue. |
| Ramp time (months) | How long from recruiting a partner to that partner producing revenue. |
Alongside the forward-looking drivers, the worksheet captures the current baseline:
| Current field | What it is |
|---|---|
| Partners with revenue | How many partners are producing revenue today. |
| Total partner revenue | The revenue partners drive today, in total. |
| Average partner revenue | Total partner revenue spread across producing partners. |
The current fields anchor the model in reality. A projection that ignores where the client is starting from is the fastest way to lose the room.
How it rolls up into the model
The Bottom-Up Partnership Model takes these drivers and builds the North Star target and the category mix. Described at the level we can stand behind, it is:
projected partners x win rate x average deal size, adjusted for ramp time, and summed across categories.
The precise arithmetic the model uses is not exposed, so do not quote a more exact formula than this to a client. What matters for you is the shape of it:
- Projected partners comes from your target and active partner counts.
- Win rate and average deal size convert those partners into revenue.
- Ramp time discounts how much of that revenue lands inside the planning
horizon, because a partner recruited late contributes less this period.
- The categories are summed into the North Star, and their relative sizes give
you the category mix that tells the client where the growth actually comes from.
Every driver is a defensible assumption
Treat each number as a claim you will have to justify:
- Target and active partners should reflect real recruiting capacity, not a
wish. The gap between target and active is your activation assumption, make it honest.
- Average deal size should come from the client's actual deals or a close
comparable, not a hopeful round number.
- Win rate should be grounded in how the client (or the partner motion) really converts.
- Ramp time should match how long partnerships in this category actually take
to produce, which is usually longer than people first say.
Completing it
- Fill the current revenue fields first so the model is anchored to today.
- For each category and region, set target and active partners on real capacity.
- Add average deal size and win rate from real deals or close comparables.
- Set ramp time honestly, then read the North Star and category mix the model produces.
Reviewing before publishing
- Drivers are realistic. Target and active partner counts sit inside real
recruiting and activation capacity.
- Win rate and deal size are grounded. Each traces back to the client's deals
or a defensible comparable, not an optimistic round number.
- Ramp time is sensible. It reflects how long these partnerships really take to
produce revenue.
- The output is believable. Sense-check the North Star target against the
client's current revenue. If the model implies a jump the client cannot picture, the drivers, not the client, usually need revisiting.