
Board Pack (Riley)
Partnership Growth Model
How partnerships contribute to revenue growth.
Partnership Growth Model (Riley)
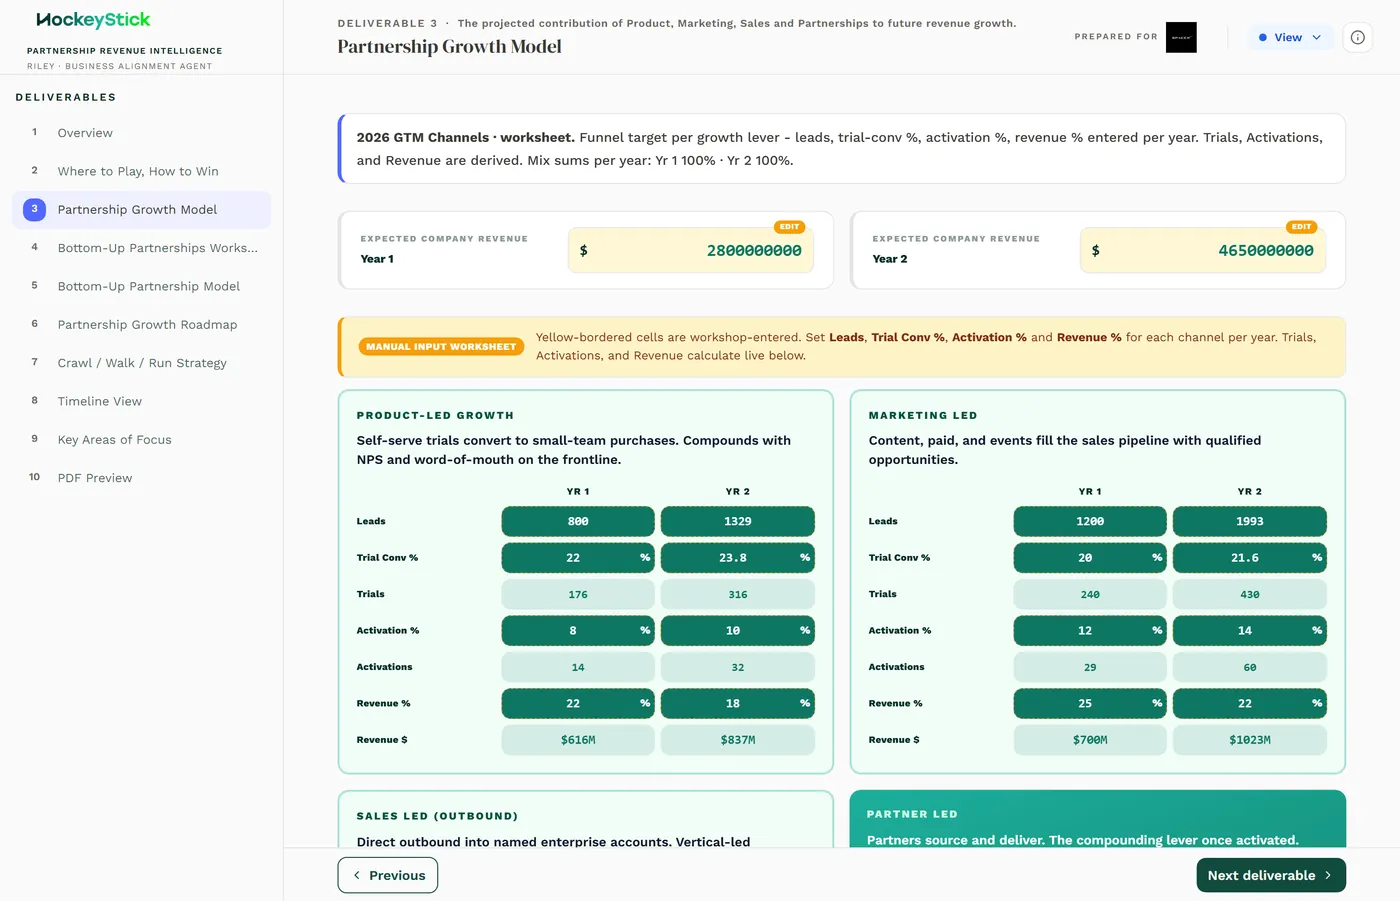
The Partnership Growth Model shows how partnerships feed the client's revenue growth, tracing leads through conversion and activation to revenue across the client's GTM channels.
What it is
A REPORT deliverable in the Board Pack (Partnership Playbook). It sits after the strategy page and frames partnerships inside the client's wider growth picture, so the board can see where partner-sourced growth fits against the other channels. Riley builds it on Alex's published Opportunity Map, and it reads from the GTM inputs captured earlier in the engagement. The page is headed by a worksheet of the client's GTM channels for the plan year.
What each section means
The page lays out the client's GTM channels and, per channel, the numbers that turn interest into revenue. The columns on the live page are:
- Leads the volume of leads the channel brings in.
- Trial Conv % the share of those leads that convert to a trial.
- Activation % the share that go on to activate.
- Revenue % the share of revenue attributed to the channel.
Reading across a row shows how a channel moves from raw leads down to its revenue contribution. Reading down the Revenue % column shows the channel mix: how much of total revenue each channel, partnerships included, is expected to carry.
Reviewing it before publishing
- The channel mix is right. The channels listed are the ones the client
actually runs, and partnerships appear as one of them.
- The conversion figures are grounded. Trial conversion and activation rates
trace to the client's real numbers or a defensible comparable, not optimistic round figures.
- The revenue shares add up. The Revenue % column reflects a mix the client
would recognise, and the partner share is consistent with the target set in the Bottom-Up Partnership Model.
- It matches the strategy. The growth the model implies is the same growth the
strategy page promised. If the two disagree, fix it before publishing.