
Command Centre overview
Reading the Dashboard
What the Command Centre dashboard shows and how to act on it.
Reading the Dashboard
The Dashboard is the first screen in the Command Centre. It gives you a cross-client view of revenue, pipeline and activity, so you can see where every engagement stands at a glance and where to spend your time next.
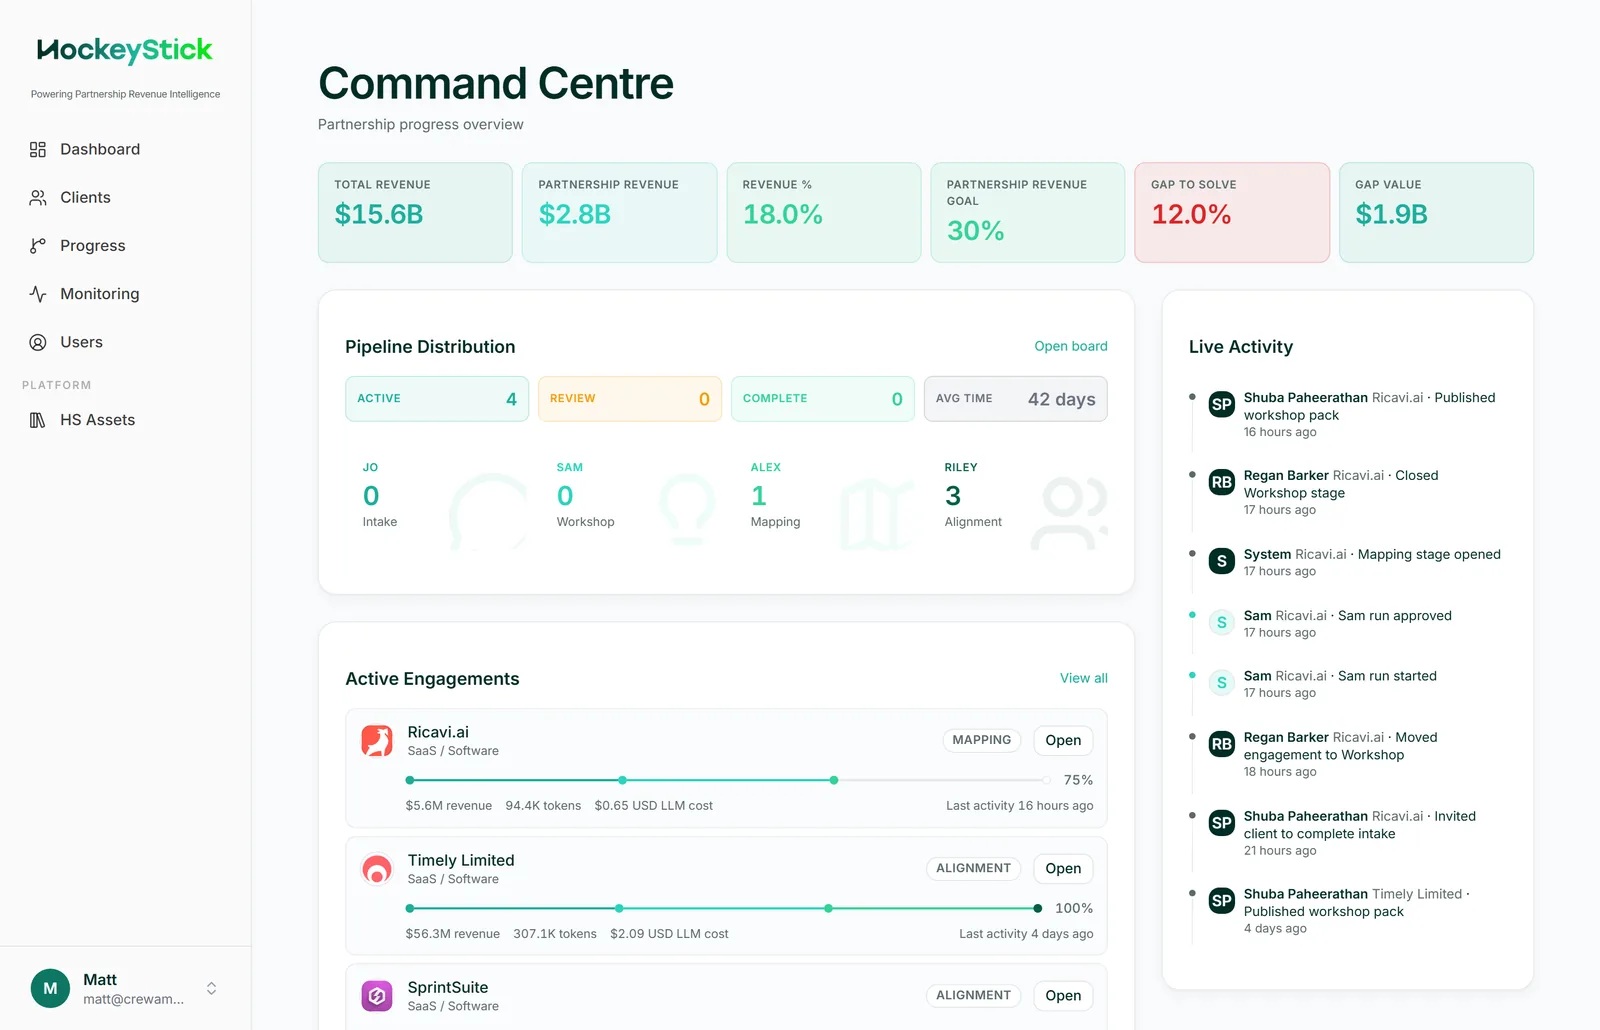
The revenue KPI strip
Along the top is a strip of revenue figures aggregated across all clients:
- Total revenue: total revenue across the book.
- Partnership revenue: the portion of that coming from partnerships.
- Revenue %: partnership revenue as a share of the total.
- Partnership revenue goal: the target you are working towards.
- Gap to solve: how far current partnership revenue sits below the goal.
- Gap value: the dollar value of that gap.
Read the strip left to right: it moves from where clients are now to the size of the opportunity still to close.
Pipeline Distribution
The Pipeline Distribution card summarises the flow of work:
- Active, Review and Complete counts show how many engagements sit in each state.
- Avg time shows how long engagements are taking to move through.
- Per-agent counts (Jo, Sam, Alex, Riley) show how much work is sitting with each agent's stage.
If work is piling up under one agent, that is where to focus.
Active Engagements and Live Activity
Below the cards, the Active Engagements list shows the engagements currently in flight so you can jump straight into any of them. The Live Activity feed streams recent events across all clients (runs launched, deliverables generated, packs published), so you can confirm at a glance that things are moving.