
Workshop Pack (Sam)
Ecosystem Worksheet
Score partner categories on Fit, Revenue and Effort, and understand the composite that ranks them.
Ecosystem Worksheet (Sam)
The Ecosystem Worksheet is where you score the categories of partner a client could build with, so the platform can rank them and highlight where to focus. It is the first worksheet in Sam's pack, and everything downstream (the ecosystem map, and Alex's partner work) reads from it. Score honestly: the ranking is only as good as the three numbers you put in per row.
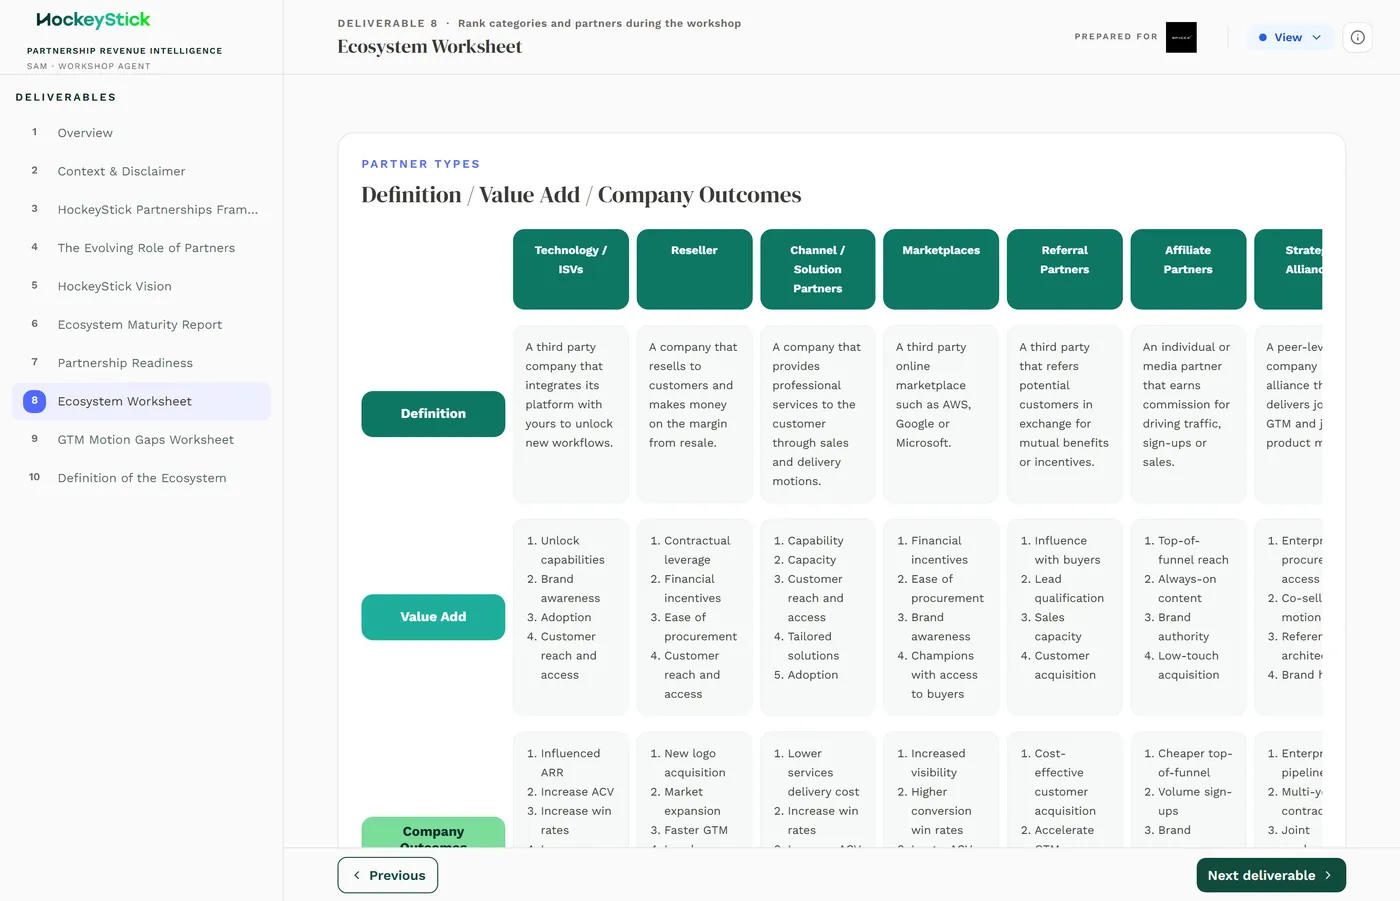
The rows: partner categories
Each row is a partner category, not a named partner. Eight canonical categories are pre-seeded and never deleted, so every client starts from the same frame:
- Affiliate
- Channel
- Technology (integration or tech partners)
- Marketplace
- OEM / Embedded
- Referral
- Reseller
- Strategic Alliance
You can add a consultant-named Other row when a client has a category that does not fit the eight. Named partners can be added under any category (name and opportunity type), but the scoring lives at the category level.
The three scores
Every category is scored on three 1 to 5 scales:
| Field | Scale | What you are scoring |
|---|---|---|
| Fit | 1-5 | Strategic fit with the client's model and positioning. |
| Revenue potential | 1-5 | The revenue this category could realistically drive. |
| Effort | 1-5 | How hard the category is to activate. Higher means harder. |
Note the direction on Effort: a 5 is bad, not good. A category that is a huge lift to stand up scores high on Effort, and that pushes it down the ranking. Do not treat Effort like the other two.
The text fields
Each category also carries three text fields. Fill them in as you score, so the ranking is defensible when you walk the client through it:
- Definition: what this category means for this specific client.
- Value Add: what the client gets from partners in this category.
- Company Outcomes: the business outcomes this category should drive.
The composite formula
The three scores combine into a single composite that ranks the categories:
composite = Fit + Revenue potential - EffortEffort is subtracted, so with 1 to 5 inputs the composite ranges from -3 to +9, and higher is better. That is the whole point of the model: a high-fit, high-revenue category that is brutally hard to activate can still rank below an easier one. A category that is a 5 / 5 on Fit and Revenue but a 5 on Effort lands at 5 + 5 - 5 = 5, which a cleaner 4 / 4 / 2 category (4 + 4 - 2 = 6) will beat.
The top 3 and where it feeds
Categories are sorted by composite, descending. The top 3 are highlighted and carry forward into the plan; the rest are parked. Those top 3 are also what the ecosystem map highlights, and they set the frame Alex works within, so a sloppy Effort score here quietly reshapes the whole downstream story.
Completing it
- Work each category row in turn. Score Fit, Revenue potential and Effort 1 to 5,
on evidence from the intake and the workshop, not on optimism.
- Fill Definition, Value Add and Company Outcomes for every category you score.
- Add named partners under a category where the client already has candidates.
- Let the composite compute and check the ordering that falls out.
Reviewing before publishing
- Scores are honest, not aspirational. A row inflated on Fit or Revenue
promotes a category the client is not ready for.
- Effort is not understated. This is the most common error. Because Effort is
subtracted, a category that is genuinely hard but scored a 2 jumps the ranking it should not. Ask "would we honestly stand this up in a quarter?" before you leave Effort low.
- The top 3 make sense. Read the three highlighted categories out loud. If the
ranking does not match what you would tell the client to focus on, one of your scores is off, usually Effort.
- Text matches the scores. The Definition and Company Outcomes should justify
the numbers, not contradict them.
Once you are happy, this rolls up into Sam's Ecosystem Maturity Report context and the wider Sam workshop pack.